Diagnostics
When a specific device misbehaves, the plugin's behaviour is invisible until you log it. These tools serve every role, so they sit on their own Diagnostics tab rather than under one feature.
- Log debug information records every request, the device's user-agent, and each codec/transcode decision to a log file you can open with View. Turn it on while troubleshooting (and to discover a device's user-agent for a profile), then off again — the log grows quickly. You can also clear it on each startup.
- Network is bandwidth constrained (Playback) tells the plugin that whenever it does transcode, it should use the device profile's lossy output (MP3/AAC/Ogg) rather than a large lossless one. Turn it on for slow Wi-Fi links.
- The Debug tab also carries low-level query tools intended for development; you can ignore them in normal use (see Other settings).
For day-to-day diagnosis the pattern is: enable logging → reproduce the problem → read the log → adjust the relevant device profile → disable logging.
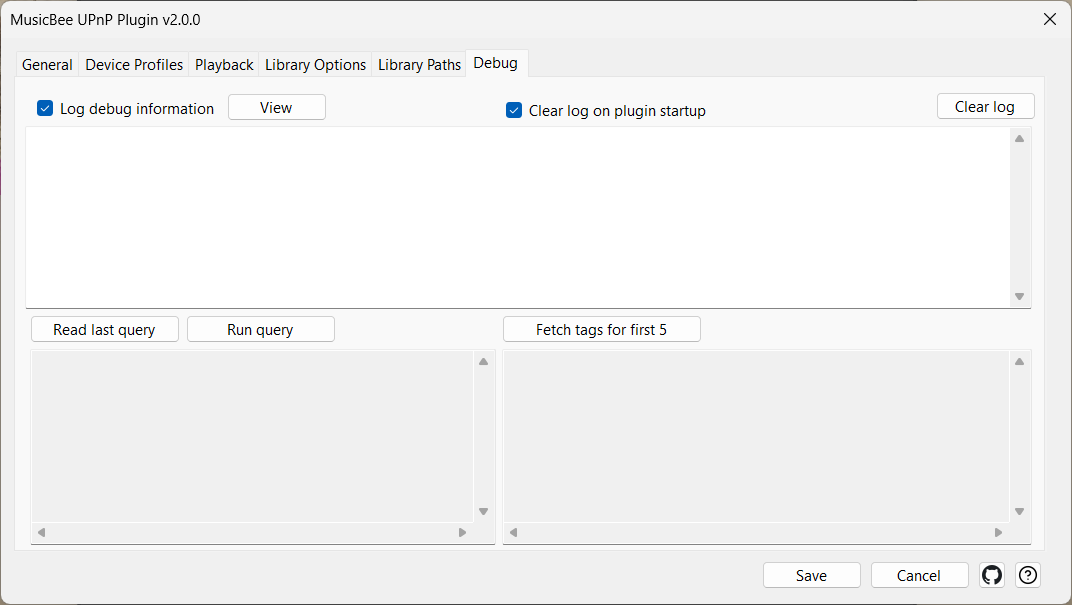
Settings
| Control | What it does |
|---|---|
| Log debug information | Logs every request, user-agent and codec decision to a file. On while troubleshooting, off otherwise. |
| Clear log on plugin startup | Empties the log each time the plugin starts. |
| View | Opens the current log file. |
| Clear log | Clears the log now. |
| Network is bandwidth constrained - transcode output to the lossy format set in the device profile above | When a transcode happens, use the device profile's lossy output format. For slow links. Requires a lossy format chosen in the profile's transcoding section. |